Telemetry
Docker healthcheck and Prometheus metrics.
Images are clickable.
Millau exposes the following endpoints on port 9100:
- Docker healthcheck
/- responds up and
200 OKwhen healthy, - responds down and
503 Service Unavailablewhen unhealthy.
- responds up and
- Prometheus metrics
/metrics.
| Metric | Description |
|---|---|
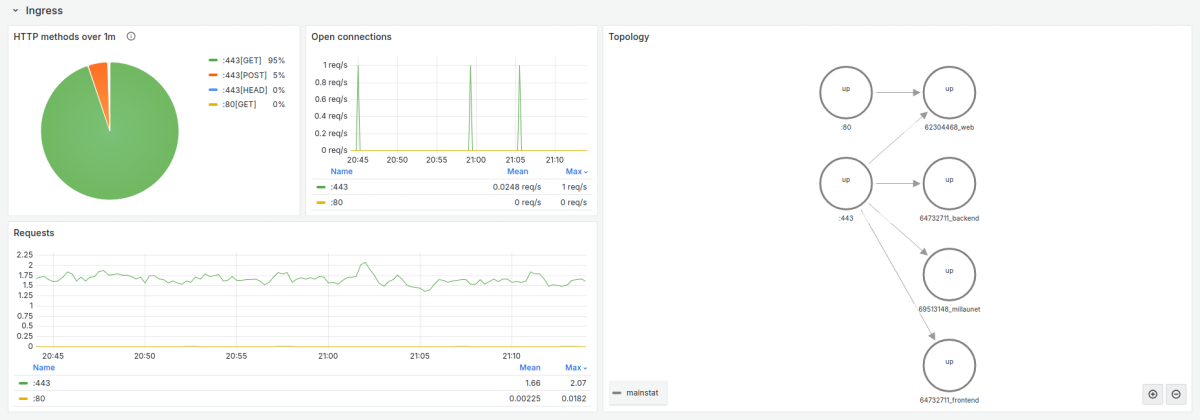
| Ingress | |
millau_ingress_open_connections | The current count of open connections by port. |
millau_ingress_requests_total | The total count of requests received by port. |
millau_ingress_requests_bytes_total | The total size of requests in bytes handled by port. |
millau_ingress_responses_bytes_total | The total size of responses in bytes handled by port. |
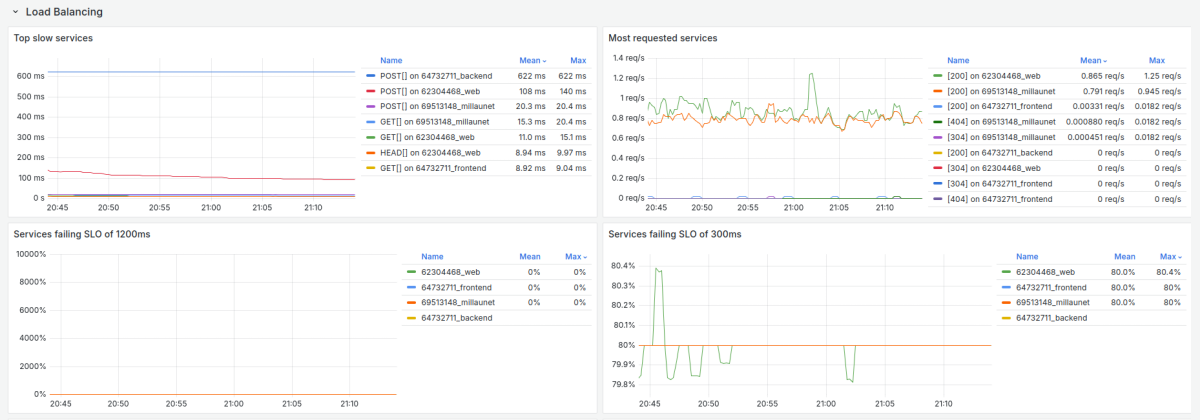
| Load Balancer | |
millau_lb_successful_requests_total | The total count of requests handled by service. |
millau_lb_failed_requests_total | The total count of requests not handled by service. |
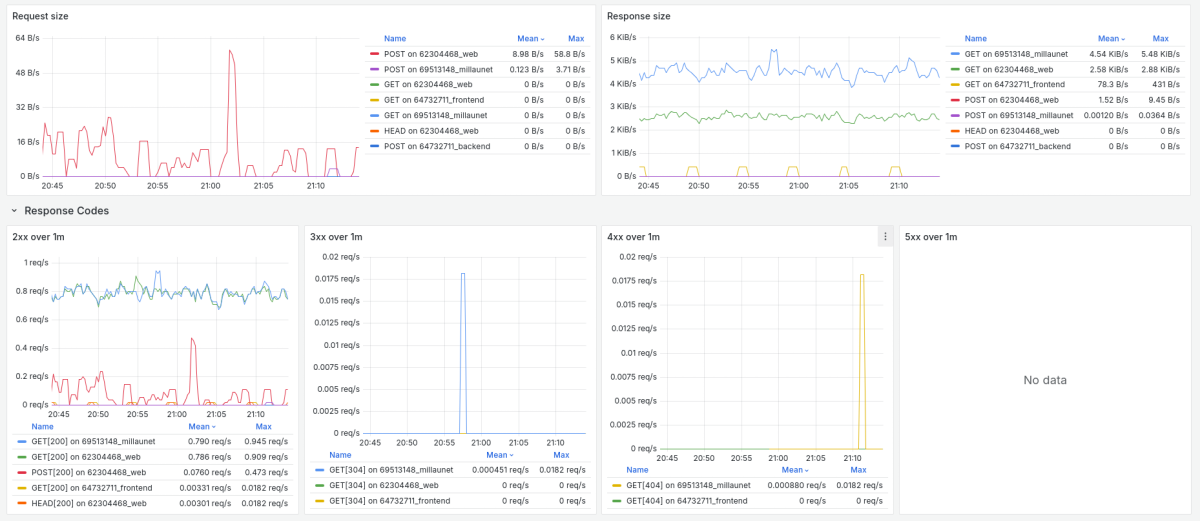
millau_lb_requests_bytes_total | The total size of requests in bytes handled by service. |
millau_lb_responses_bytes_total | The total size of responses in bytes handled by service. |
millau_lb_retries_total | The count of retries made for service. |
millau_lb_status | Current service status, 0 for down or 1 for up. |
millau_lb_request_duration_seconds | Request handling histogram by service. |
millau_topology | Requests routed to services. |
Dashboard
Millau has an official Grafana dashboard. You can try it out locally using the manifest below, which sets up Millau, Echo service, Prometheus and Grafana together.
Once the stack is running, log in Grafana at http://localhost:3000 with username admin and password admin.
The millau.json is already installed and ready to use.
Manifests
services:
  proxy:
    image: codelev/millau:latest
    volumes:
      - /var/run/docker.sock:/var/run/docker.sock:ro
    ports:
      - "8080:80"
  echo:
    image: codelev/echo-spring
    labels:
      - "millau.enabled=true"
      - "millau.port=9000"
  prometheus:
    image: prom/prometheus:latest
    volumes:
      - ./prometheus.yml:/etc/prometheus/prometheus.yml
    command:
      - '--config.file=/etc/prometheus/prometheus.yml'
  grafana:
    image: grafana/grafana:latest
    ports:
      - "3000:3000"
    volumes:
      - ./dashboards.yml:/etc/grafana/provisioning/dashboards/dashboards.yml
      - ./datasources.yml:/etc/grafana/provisioning/datasources/datasources.yml
    environment:
      - GF_SECURITY_ADMIN_PASSWORD=admin